画廊
绘制项目LOGO底图
import cartopy.crs as ccrs
import matplotlib.pyplot as plt
from cnmaps import get_adm_maps

fig = plt.figure(figsize=(5,5))
proj = ccrs.Orthographic(central_longitude=100.0, central_latitude=30)
ax = fig.add_subplot(111, projection=proj)

ax.stock_img()
china, south_sea = get_adm_maps(country='中国', level='国', record='all', only_polygon=True)

ax.set_global()
ax.add_geometries(china, crs=ccrs.PlateCarree(), edgecolor='r', facecolor='r')
ax.add_geometries(south_sea, crs=ccrs.PlateCarree(), edgecolor='r')
ax.outline_patch.set_edgecolor('white')

plt.show()
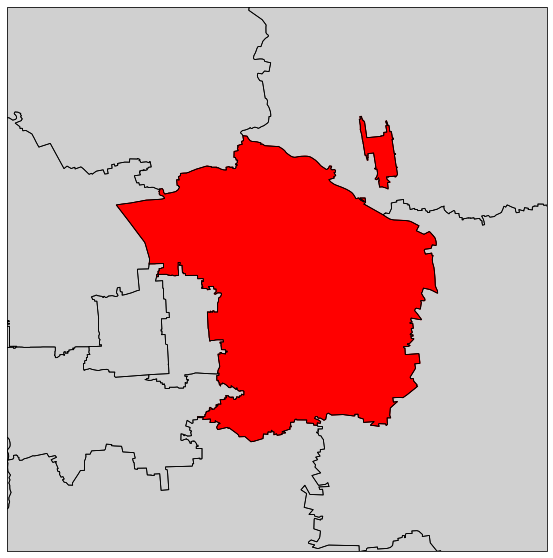
绘制北京市朝阳区行政图
import cartopy.crs as ccrs
import matplotlib.pyplot as plt
from cnmaps import get_adm_maps, draw_maps

fig = plt.figure(figsize=(10,10))
ax = fig.add_subplot(111, projection=ccrs.PlateCarree())

beijing = get_adm_maps(city='北京市', record='first', only_polygon=True)
chaoyang = get_adm_maps(district='朝阳区', level='区县', record='first', only_polygon=True)

ax.add_geometries(beijing, crs=ccrs.PlateCarree(), edgecolor='#D0D0D0', facecolor='#D0D0D0')
draw_maps(get_adm_maps(city='北京市', level='区县'), color='k', linewidth=0.8)
ax.add_geometries(chaoyang, crs=ccrs.PlateCarree(), edgecolor='r', facecolor='r')
ax.set_extent(chaoyang.get_extent(buffer=0.1))

plt.show()
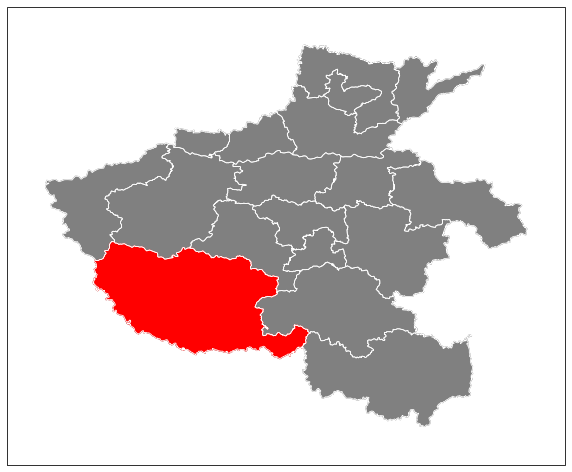
绘制河南省行政图
河南省行政图,南阳市高亮
import cartopy.crs as ccrs
import matplotlib.pyplot as plt
from cnmaps import get_adm_maps, draw_maps

fig = plt.figure(figsize=(10,10))
ax = fig.add_subplot(111, projection=ccrs.PlateCarree())

province = get_adm_maps(province='河南省', record='first', only_polygon=True)
city = get_adm_maps(city='南阳市', record='first', only_polygon=True)
ax.add_geometries(province, crs=ccrs.PlateCarree(), edgecolor='grey', facecolor='grey')
ax.add_geometries(city, crs=ccrs.PlateCarree(), edgecolor='r', facecolor='r')
draw_maps(get_adm_maps(province='河南省', level='市'), color='w', linewidth=0.8)
ax.set_extent(province.get_extent(buffer=0.5))

plt.show()
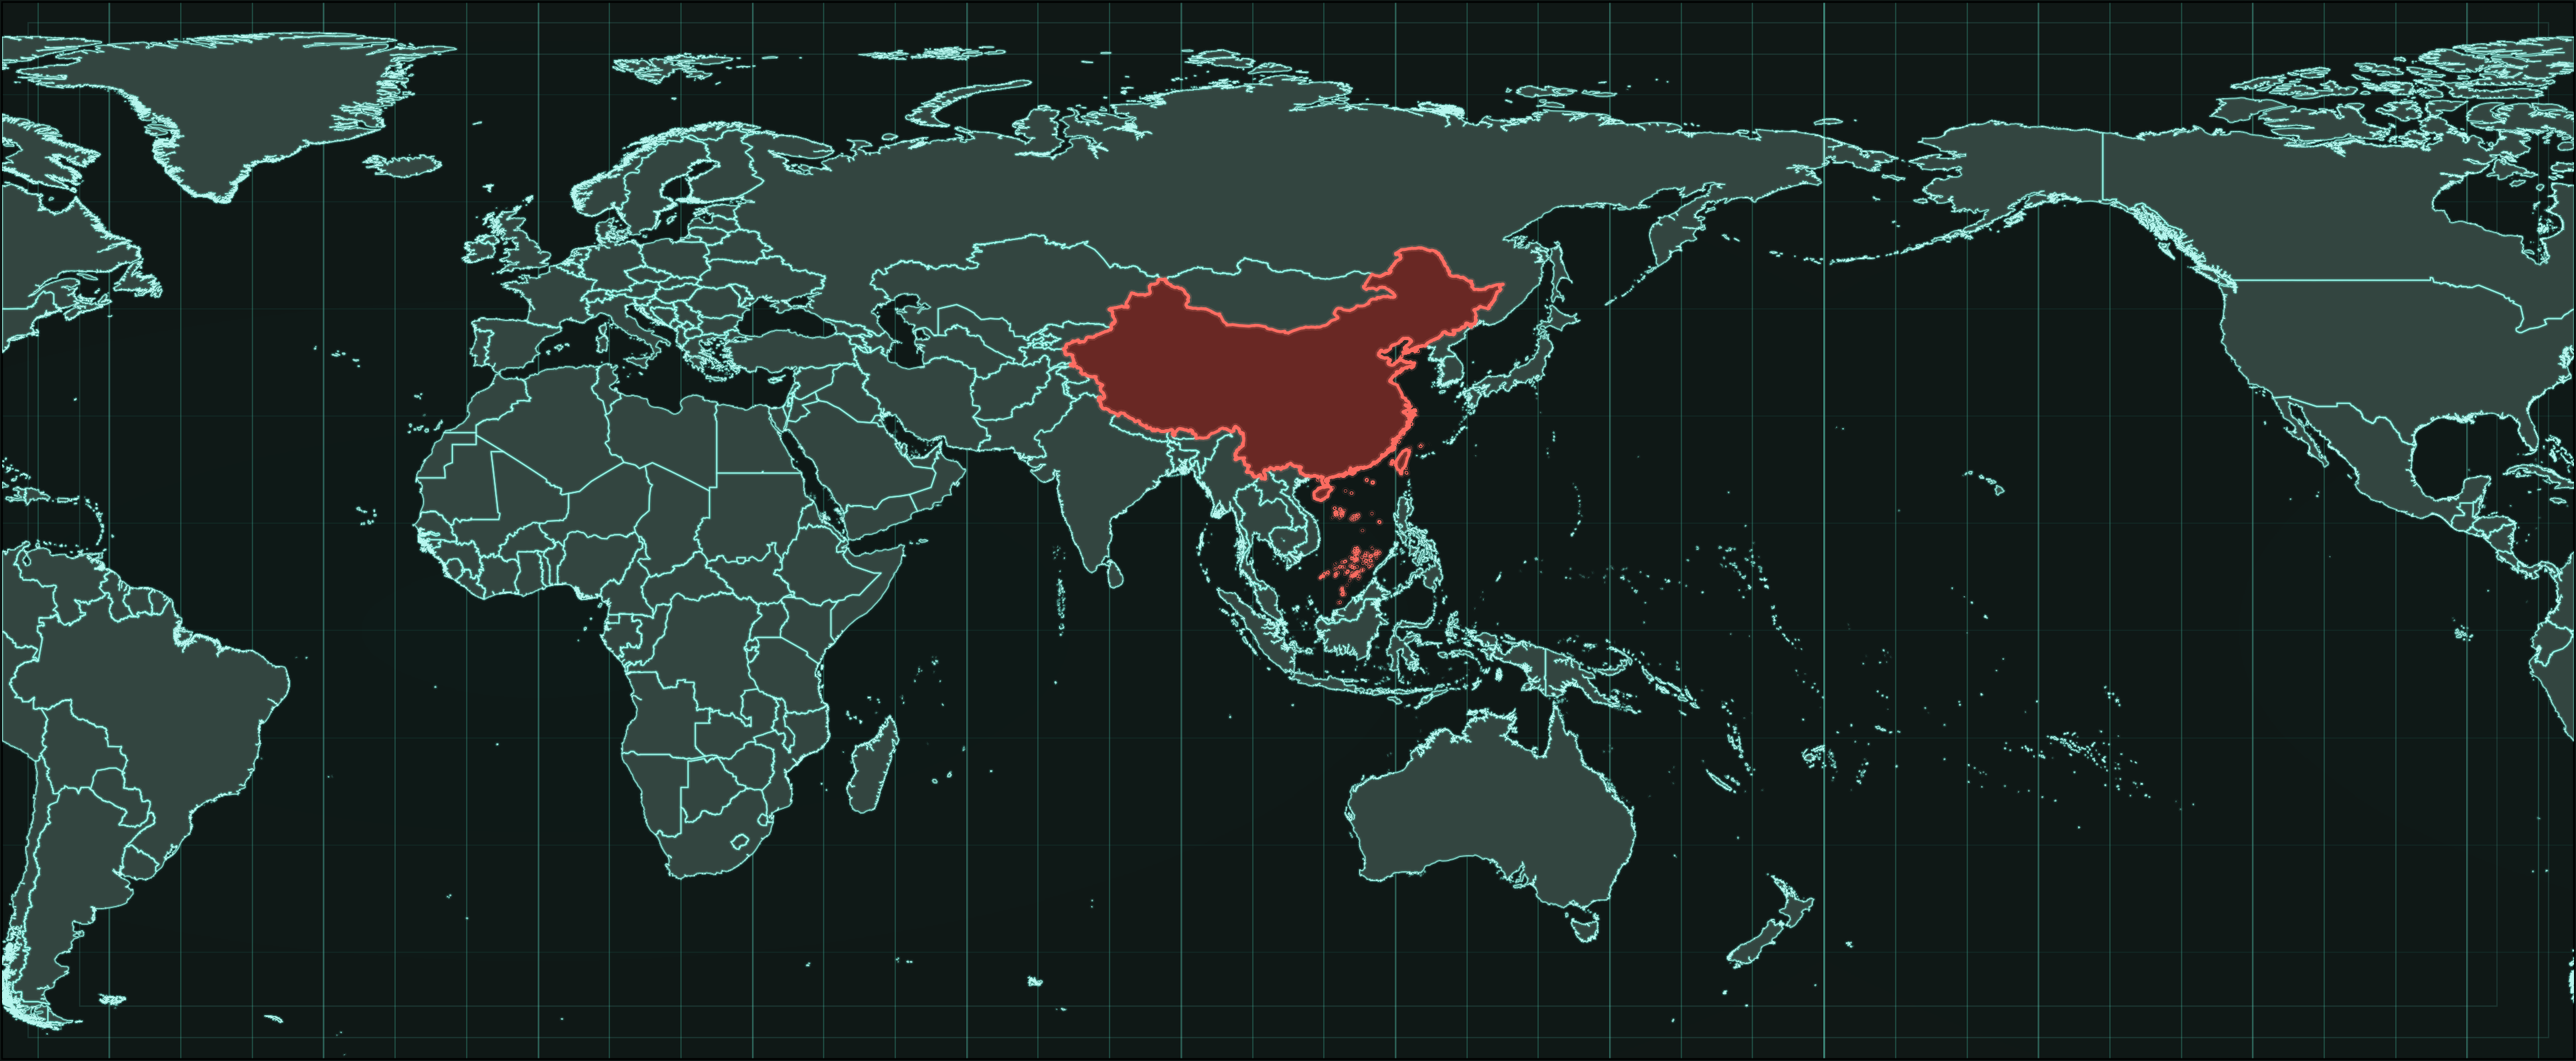
绘制科技风全球边界图
下面这个例子使用 cnmaps 查询全球国家级边界与中国国界,并绘制一张以中国为视觉焦点的科技风全球地图。
import cartopy.crs as ccrs
import matplotlib.pyplot as plt
import numpy as np
from matplotlib.patches import Rectangle

from cnmaps import get_adm_maps

proj = ccrs.PlateCarree(central_longitude=105)
data_crs = ccrs.PlateCarree()

china = get_adm_maps(country="中国", level="国", only_polygon=True, record="first")
world = get_adm_maps(level="国", source="世界银行", only_polygon=True)

fig = plt.figure(figsize=(18, 10), dpi=220, facecolor="#101816")
ax = fig.add_axes([0.015, 0.03, 0.97, 0.94], projection=proj)
ax.set_facecolor("#101816")
ax.set_global()
ax.set_extent([-180, 180, -60, 88], crs=data_crs)

ny, nx = 900, 1800
x = np.linspace(-1, 1, nx)
y = np.linspace(-1, 1, ny)
xx, yy = np.meshgrid(x, y)
rr = np.sqrt((xx * 0.82) ** 2 + (yy * 1.08) ** 2)
grad = np.clip(1 - rr, 0, 1)
base = np.zeros((ny, nx, 4))
base[..., 0] = 0.05
base[..., 1] = 0.12
base[..., 2] = 0.11
base[..., 3] = 0.38 * grad
ax.imshow(base, extent=[-180, 180, -90, 90], transform=data_crs, origin="lower", zorder=0)

for lon in np.arange(-180, 181, 10):
    ax.plot([lon, lon], [-60, 88], transform=data_crs, color="#4fe0c4", lw=0.55, alpha=0.28, zorder=1)
for lon in np.arange(-180, 181, 30):
    ax.plot([lon, lon], [-60, 88], transform=data_crs, color="#82ffea", lw=0.95, alpha=0.14, zorder=1)
for lat in np.arange(-60, 91, 15):
    ax.plot([-180, 180], [lat, lat], transform=data_crs, color="#36baa2", lw=0.42, alpha=0.12, zorder=1)

for x0, y0, w, h in [(0.0, 0.0, 1.0, 1.0), (0.01, 0.02, 0.98, 0.96), (0.03, 0.05, 0.94, 0.90)]:
    ax.add_patch(
        Rectangle(
            (x0, y0),
            w,
            h,
            fill=False,
            ec="#6ff5de",
            lw=0.7,
            alpha=0.12,
            zorder=2,
            transform=ax.transAxes,
        )
    )

ax.add_geometries(world, crs=data_crs, facecolor="#334540", edgecolor="none", zorder=3)
ax.add_geometries(world, crs=data_crs, facecolor="none", edgecolor="#97fff0", linewidth=2.2, alpha=0.05, zorder=4)
ax.add_geometries(world, crs=data_crs, facecolor="none", edgecolor="#60e4d0", linewidth=0.95, alpha=0.52, zorder=5)
ax.add_geometries(world, crs=data_crs, facecolor="none", edgecolor="#c1fff8", linewidth=0.25, alpha=0.92, zorder=6)

ax.add_geometries([china], crs=data_crs, facecolor="#692824", edgecolor="none", zorder=7)
ax.add_geometries([china], crs=data_crs, facecolor="none", edgecolor="#ff8c81", linewidth=3.2, alpha=0.16, zorder=8)
ax.add_geometries([china], crs=data_crs, facecolor="none", edgecolor="#ff6d62", linewidth=1.45, alpha=0.98, zorder=9)

fig.savefig("world-tech-map-centered-v2.png", facecolor=fig.get_facecolor(), bbox_inches="tight", pad_inches=0.015)