使用指南
我们先用几个小例子,快速入门cnmaps的基本功能的使用。
查询行政边界
你可以使用 get_adm_maps 轻松查询到你想要的行政边界,例如你想要查询北京市,可以使用以下方式。
In [1]: from cnmaps import get_adm_maps

In [2]: get_adm_maps(city='北京市')
Out[2]:
[{'country': '中华人民共和国',
'province': '北京市',
'city': '北京市',
'district': None,
'level': '市',
'source': '高德',
'kind': '陆地',
'geometry': <MULTIPOLYGON (((117.203 40.081, 117.203 40.081, 117.202 40.081, 117.201 40....>,
'longitude': 116.41262547855654,
'latitude': 40.18562798032104,
'国家': '中华人民共和国',
'省/直辖市': '北京市',
'市': '北京市',
'区/县': None,
'级别': '市',
'来源': '高德',
'类型': '陆地',
'经度': 116.41262547855654,
'纬度': 40.18562798032104}]
查询海淀区。
In [1]: from cnmaps import get_adm_maps

In [2]: get_adm_maps(district='海淀区')
Out[2]:
[{'country': '中华人民共和国',
'province': '北京市',
'city': '北京市',
'district': '海淀区',
'level': '区县',
'source': '高德',
'kind': '陆地',
'geometry': <MULTIPOLYGON (((116.043 40.084, 116.043 40.084, 116.043 40.085, 116.043 40....>,
'longitude': 116.2269627751591,
'latitude': 40.02558182702156,
'国家': '中华人民共和国',
'省/直辖市': '北京市',
'市': '北京市',
'区/县': '海淀区',
'级别': '区县',
'来源': '高德',
'类型': '陆地',
'经度': 116.2269627751591,
'纬度': 40.02558182702156}]
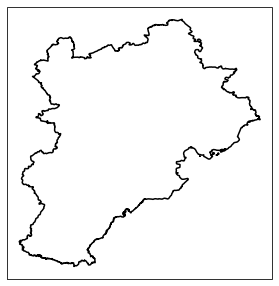
查询山西省。
In [1]: from cnmaps import get_adm_maps

In [2]: get_adm_maps(province='山西省')
Out[2]:
[{'country': '中华人民共和国',
'province': '山西省',
'city': None,
'district': None,
'level': '省',
'source': '高德',
'kind': '陆地',
'geometry': <MULTIPOLYGON (((110.898 34.67, 110.888 34.653, 110.878 34.645, 110.856 34.6...>,
'longitude': 112.289474734092,
'latitude': 37.57235785367627,
'国家': '中华人民共和国',
'省/直辖市': '山西省',
'市': None,
'区/县': None,
'级别': '省',
'来源': '高德',
'类型': '陆地',
'经度': 112.289474734092,
'纬度': 37.57235785367627}]
查询山西省下辖地级市。
In [1]: from cnmaps import get_adm_maps

In [2]: maps = get_adm_maps(province='山西省', level='市')
In [3]: len(maps)
Out[3]: 11

In [4]: maps[0]['市']
Out[4]: '太原市'

In [5]: get_adm_maps(province='山西省', level='市', engine='geopandas')
Out[5]:
            country province city district level source kind   longitude   latitude                                           geometry  国家 省/直辖市    市   区/县 级别  来源  类型          经度         纬度
0   中华人民共和国      山西省  太原市     None     市     高德   陆地  112.549248  37.857014  MULTIPOLYGON (((113.06683 38.05646, 113.06708 ...  中华人民共和国   山西省  太原市  None  市  高德  陆地  112.549248  37.857014
1   中华人民共和国      山西省  大同市     None     市     高德   陆地  113.295259  40.090311  MULTIPOLYGON (((113.57727 39.43812, 113.57460 ...  中华人民共和国   山西省  大同市  None  市  高德  陆地  113.295259  40.090311
2   中华人民共和国      山西省  阳泉市     None     市     高德   陆地  113.583285  37.861188  MULTIPOLYGON (((113.99691 37.70448, 113.99567 ...  中华人民共和国   山西省  阳泉市  None  市  高德  陆地  113.583285  37.861188
...           ...        ...  ...      ...   ...    ...  ...         ...        ...                                                ...   ...   ...   ...   ...  ...  ...         ...        ...
备注
engine='geopandas' 时,返回结果中的 geometry 列保持为 原生 Shapely geometry;默认 engine=None 的列表 / 字典接口则继续返回 MapPolygon,以兼容历史用法。当你向 get_adm_maps 传递行政区域的名称时,应传入行政区的正式全称,简称无法识别,如果不知道全称可以通过 get_adm_names 查询,或者从 cnmaps-data 数据集索引 查询。
警告
当前版本仍然兼容 record['国家']、record['省/直辖市'] 这类中文 key 的访问方式,但我们计划在未来 3.x 版本中移除这些中文 key。新代码建议统一使用英文 key 或点号属性访问,例如 record['country']、record.country、record.longitude。字段的 value 仍然保持中文形式。
假如我们不知道省一级行政区的正式名称,可以执行:
In [1]: from cnmaps import get_adm_names

In [2]: get_adm_names(level='省')
Out[2]:
['北京市',
'天津市',
'河北省',
... # 为节省篇幅,中间部分省略
'台湾省',
'香港特别行政区',
'澳门特别行政区']
当我们已经知道了省的名称以后,可以继续下探到市,以四川省为例:
In [1]: from cnmaps import get_adm_names

In [2]: get_adm_names(province='四川省', level='市')
Out[2]:
['成都市',
'自贡市',
'攀枝花市',
... # 为节省篇幅,中间部分省略
'阿坝藏族羌族自治州',
'甘孜藏族自治州',
'凉山彝族自治州']
知道了市的名称以后,可以继续下探到区县,以成都市为例:
In [1]: from cnmaps import get_adm_names

In [2]: get_adm_names(province='四川省', city='成都市', level='区县')
Out[2]:
['锦江区',
'青羊区',
'金牛区',
... # 为节省篇幅,中间部分省略
'邛崃市',
'崇州市',
'简阳市']
如果你已经明确知道多个名称,也可以直接一次性批量查询。例如:
from cnmaps import get_adm_maps

jingjin = get_adm_maps(province=['北京市', '天津市'], level='省')
henan_cities = get_adm_maps(province='河南省', city=['郑州市', '洛阳市'], level='市')
east_asia = get_adm_maps(country=['中国', 'JPN', 'KOR'], level='国')
需要注意的是,一次调用仍然只对应一个行政等级。也就是说,像日本(国级)和四川省(省级)这样的混合查询,不能在同一个 get_adm_maps(...) 调用里直接返回,而应拆成两次查询。
如果你希望把多个查询结果直接画出来,也可以参考下面这个最小示例:
import cartopy.crs as ccrs
import matplotlib.pyplot as plt

from cnmaps import draw_maps, get_adm_maps

selected = get_adm_maps(province=["北京市", "天津市"], level="省")

fig = plt.figure(figsize=(7, 7))
ax = fig.add_subplot(111, projection=ccrs.PlateCarree())
draw_maps(selected, ax=ax, linewidth=1.2, color="#d1495b")
ax.set_extent([115.0, 119.5, 38.2, 41.5], crs=ccrs.PlateCarree())
plt.show()
查询行政区中心点坐标
get_adm_maps 当前返回的记录里同时包含 longitude 和 latitude 字段,默认直接使用当前行政区边界几何的质心。这个规则对省、市、区县和国家级边界都通用;像舟山、三沙这类由多个多边形组成的城市,也会按整体 MultiPolygon 计算一个统一中心点。默认列表接口还支持点号访问,因此可以直接写 record.longitude 和 record.latitude。
如果你只是想拿到坐标用于标注、统计或导出,可以直接像下面这样查询:
from cnmaps import get_adm_maps

china = get_adm_maps(country='中国', level='国', record='first')
print(china.longitude, china.latitude)

henan = get_adm_maps(province='河南省', record='first')
print(henan.longitude, henan.latitude)

nanyang = get_adm_maps(city='南阳市', record='first')
print(nanyang.longitude, nanyang.latitude)

haidian = get_adm_maps(district='海淀区', record='first')
print(haidian.longitude, haidian.latitude)
备注
这里的 longitude / latitude 目前统一来自边界几何的整体质心。对于中国、省级边界以及多数城市,这样通常是直观的;但对像美国这类由本土、海外州或远距离岛屿共同组成、国土跨度很大的国家和地区,整体质心可能并不等同于用户直觉里的“代表位置”,使用时应当谨慎理解。
绘制行政边界
前面使用 get_adm_maps 获取的行政边界地图列表,可以直接传入 draw_maps 函数进行绘图。
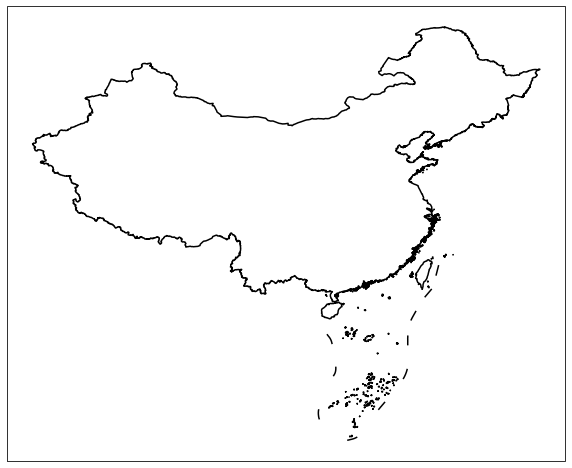
我们先来用最简单直接的方式,来绘制你的第一张中国国界地图。
import cartopy.crs as ccrs
import matplotlib.pyplot as plt
from cnmaps import get_adm_maps, draw_maps

fig = plt.figure(figsize=(10,10))
ax = fig.add_subplot(111, projection=ccrs.PlateCarree())

draw_maps(get_adm_maps(country='中国', level='国'))

plt.show()
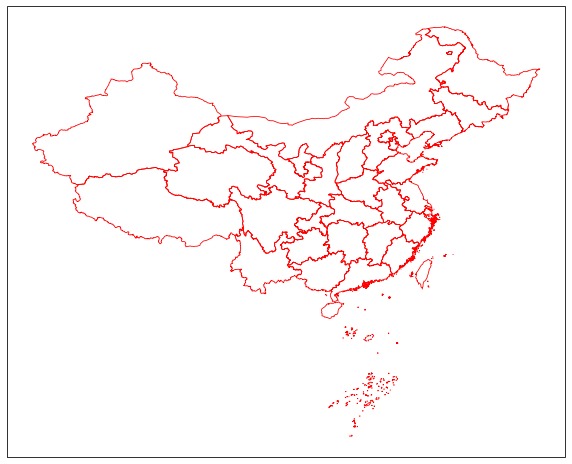
我们再来绘制一张各省的行政边界地图。
import cartopy.crs as ccrs
import matplotlib.pyplot as plt
from cnmaps import get_adm_maps, draw_maps

fig = plt.figure(figsize=(10,10))
ax = fig.add_subplot(111, projection=ccrs.PlateCarree())

draw_maps(get_adm_maps(level='省'), linewidth=0.8, color='r')

plt.show()
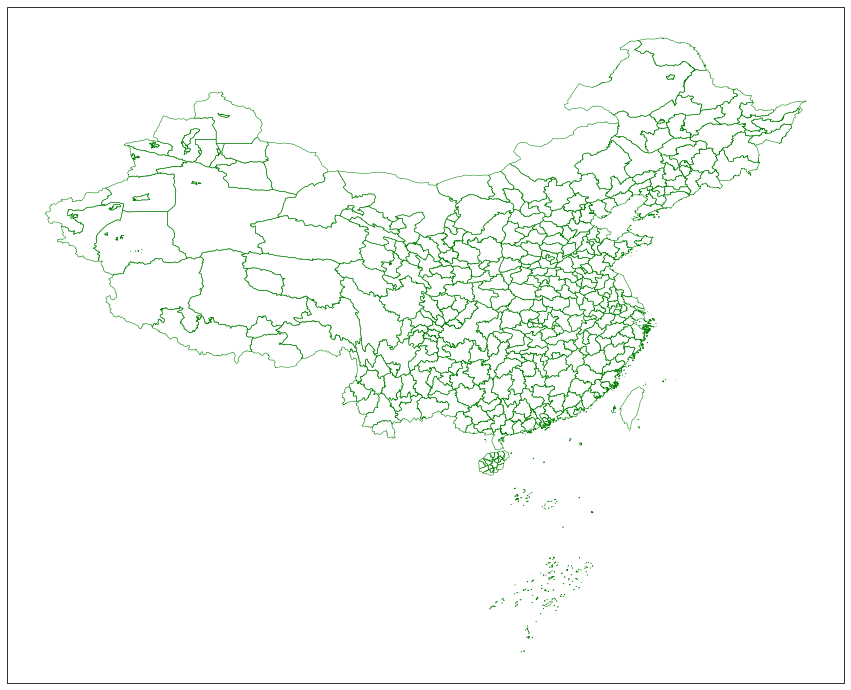
然后是市级行政区。
import cartopy.crs as ccrs
import matplotlib.pyplot as plt
from cnmaps import get_adm_maps, draw_maps

fig = plt.figure(figsize=(15,15))
ax = fig.add_subplot(111, projection=ccrs.PlateCarree())

draw_maps(get_adm_maps(level='市'), linewidth=0.5, color='g')

plt.show()
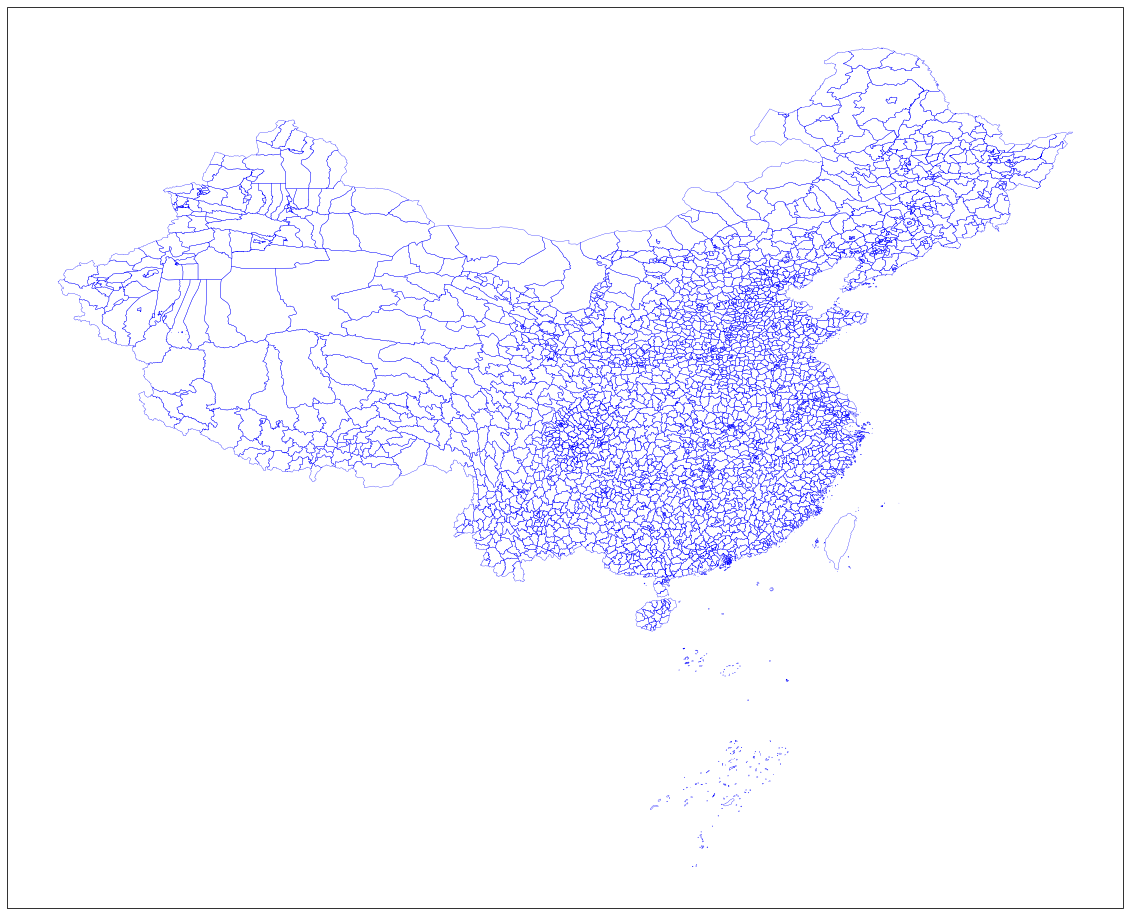
最后是区县。
import cartopy.crs as ccrs
import matplotlib.pyplot as plt
from cnmaps import get_adm_maps, draw_maps

fig = plt.figure(figsize=(20,20))
ax = fig.add_subplot(111, projection=ccrs.PlateCarree())

draw_maps(get_adm_maps(level='区县'), linewidth=0.3, color='b')

plt.show()
中国与周边国家国界
cnmaps-data 中的国外国家级边界统一存放在 level='国' 记录里。若只想查看中国周边,可直接取全部国家级记录后与中国国界同图绘制;在中国周边视角下,远处国家不会出现在当前范围内,无需额外区分“邻国”与“非邻国”。
import cartopy.crs as ccrs
import matplotlib.pyplot as plt

from cnmaps import draw_maps, get_adm_maps


fig = plt.figure(figsize=(11, 9))
ax = fig.add_subplot(111, projection=ccrs.PlateCarree())
ax.set_extent([72, 136, 15, 55], crs=ccrs.PlateCarree())

china = get_adm_maps(country="中国", level="国", only_polygon=True, record="first")
world = get_adm_maps(level="国", only_polygon=True)

draw_maps(world, ax=ax, linewidth=0.7, color="steelblue")
draw_maps([china], ax=ax, linewidth=1.1, color="darkred")

plt.savefig("china-and-neighbors-borders.png", bbox_inches="tight")
plt.show()

全球国家边界
绘制全球国家边界时,也可以直接使用 level='国' 一次取回全部国家级记录;若只需中国国界,再显式传入 country='中国' 即可。
如果希望先查看最常见、最直观的全球边界展示,可以先从常规平面投影开始。下面这个例子使用 PlateCarree 投影绘制全球国家边界,并用更醒目的颜色叠加中国国界:
import cartopy.crs as ccrs
import matplotlib.pyplot as plt

from cnmaps import draw_maps, get_adm_maps


fig = plt.figure(figsize=(12, 6))
proj = ccrs.PlateCarree(central_longitude=105)
ax = fig.add_subplot(111, projection=proj)
ax.set_global()

china = get_adm_maps(country="中国", level="国", only_polygon=True, record="first")
world = get_adm_maps(level="国", only_polygon=True)

draw_maps(world, ax=ax, linewidth=0.22, color="dimgray")
draw_maps([china], ax=ax, linewidth=0.75, color="crimson")

plt.savefig("world-countries-borders-flat.png", bbox_inches="tight")
plt.show()

使用行政区中心点辅助制图
前面的 longitude / latitude 字段除了可以直接查询,也很适合在地图上做标注或打点。这里集中展示几种常见的制图用法。
下面这个例子把北京、上海、舟山和三沙放在一张 2x2 图里,红点就是查询结果里的 longitude / latitude:
import cartopy.crs as ccrs
import matplotlib.pyplot as plt

from cnmaps import draw_map, get_adm_maps


city_cases = [
    ("Beijing", "北京市"),
    ("Shanghai", "上海市"),
    ("Zhoushan", "舟山市"),
    ("Sansha", "三沙市"),
]


fig, axes = plt.subplots(
    2,
    2,
    figsize=(10, 8),
    subplot_kw={"projection": ccrs.PlateCarree()},
)

for ax, (english_name, city_name) in zip(axes.flat, city_cases):
    row = get_adm_maps(city=city_name, record="first")
    geom = row["geometry"]

    draw_map(geom, ax=ax, color="#2a6fdb", linewidth=1.0)
    ax.scatter(
        [row.longitude],
        [row.latitude],
        color="#d62828",
        s=28,
        transform=ccrs.PlateCarree(),
        zorder=5,
    )
    ax.set_title(f"{english_name} centroid", fontsize=12)
    ax.set_extent(geom.get_extent(buffer=0.8), crs=ccrs.PlateCarree())
    ax.gridlines(draw_labels=False, linewidth=0.4, color="#999999", alpha=0.4, linestyle="--")

plt.tight_layout()
plt.savefig("city-centroids-overview.png", bbox_inches="tight")
plt.show()

同样的写法也适用于省级和国家级边界。下面两段示例分别展示省级和国家级的质心点:
import cartopy.crs as ccrs
import matplotlib.pyplot as plt

from cnmaps import draw_map, get_adm_maps


province_cases = [
    ("Beijing", "北京市"),
    ("Sichuan", "四川省"),
    ("Guangdong", "广东省"),
    ("Xinjiang", "新疆维吾尔自治区"),
]


fig, axes = plt.subplots(
    2,
    2,
    figsize=(10, 8),
    subplot_kw={"projection": ccrs.PlateCarree()},
)

for ax, (english_name, province_name) in zip(axes.flat, province_cases):
    row = get_adm_maps(province=province_name, record="first")
    geom = row["geometry"]

    draw_map(geom, ax=ax, color="#2a6fdb", linewidth=1.0)
    ax.scatter(
        [row.longitude],
        [row.latitude],
        color="#d62828",
        s=28,
        transform=ccrs.PlateCarree(),
        zorder=5,
    )
    ax.set_title(f"{english_name} centroid", fontsize=12)
    ax.set_extent(geom.get_extent(buffer=1.0), crs=ccrs.PlateCarree())
    ax.gridlines(draw_labels=False, linewidth=0.4, color="#999999", alpha=0.4, linestyle="--")

plt.tight_layout()
plt.savefig("province-centroids-overview.png", bbox_inches="tight")
plt.show()

import cartopy.crs as ccrs
import matplotlib.pyplot as plt

from cnmaps import draw_map, get_adm_maps


country_cases = [
    ("China", "中国"),
    ("Japan", "日本"),
    ("India", "印度"),
    ("Germany", "德国"),
]


fig, axes = plt.subplots(
    2,
    2,
    figsize=(10, 8),
    subplot_kw={"projection": ccrs.PlateCarree()},
)

for ax, (english_name, country_name) in zip(axes.flat, country_cases):
    row = get_adm_maps(country=country_name, level="国", record="first")
    geom = row["geometry"]

    draw_map(geom, ax=ax, color="#2a6fdb", linewidth=1.0)
    ax.scatter(
        [row.longitude],
        [row.latitude],
        color="#d62828",
        s=28,
        transform=ccrs.PlateCarree(),
        zorder=5,
    )
    ax.set_title(f"{english_name} centroid", fontsize=12)
    ax.set_extent(geom.get_extent(buffer=2.0), crs=ccrs.PlateCarree())
    ax.gridlines(draw_labels=False, linewidth=0.4, color="#999999", alpha=0.4, linestyle="--")

plt.tight_layout()
plt.savefig("country-centroids-overview.png", bbox_inches="tight")
plt.show()

若你想进一步把质心坐标用于标注,也可以先绘制中国省级边界,再按各省会 / 首府的质心位置打点并标注英文名称。下面这个例子里,北京使用五角星强调,其他省会用圆点表示:
import cartopy.crs as ccrs
import matplotlib.pyplot as plt

from cnmaps import draw_maps, get_adm_maps


province_capitals = [
    ("北京市", "北京市", "Beijing"),
    ("天津市", "天津市", "Tianjin"),
    ("河北省", "石家庄市", "Shijiazhuang"),
    ("山西省", "太原市", "Taiyuan"),
    ("内蒙古自治区", "呼和浩特市", "Hohhot"),
    ("辽宁省", "沈阳市", "Shenyang"),
    ("吉林省", "长春市", "Changchun"),
    ("黑龙江省", "哈尔滨市", "Harbin"),
    ("上海市", "上海市", "Shanghai"),
    ("江苏省", "南京市", "Nanjing"),
    ("浙江省", "杭州市", "Hangzhou"),
    ("安徽省", "合肥市", "Hefei"),
    ("福建省", "福州市", "Fuzhou"),
    ("江西省", "南昌市", "Nanchang"),
    ("山东省", "济南市", "Jinan"),
    ("河南省", "郑州市", "Zhengzhou"),
    ("湖北省", "武汉市", "Wuhan"),
    ("湖南省", "长沙市", "Changsha"),
    ("广东省", "广州市", "Guangzhou"),
    ("广西壮族自治区", "南宁市", "Nanning"),
    ("海南省", "海口市", "Haikou"),
    ("重庆市", "重庆市", "Chongqing"),
    ("四川省", "成都市", "Chengdu"),
    ("贵州省", "贵阳市", "Guiyang"),
    ("云南省", "昆明市", "Kunming"),
    ("西藏自治区", "拉萨市", "Lhasa"),
    ("陕西省", "西安市", "Xi'an"),
    ("甘肃省", "兰州市", "Lanzhou"),
    ("青海省", "西宁市", "Xining"),
    ("宁夏回族自治区", "银川市", "Yinchuan"),
    ("新疆维吾尔自治区", "乌鲁木齐市", "Urumqi"),
]

fig = plt.figure(figsize=(12, 10), dpi=180)
ax = fig.add_subplot(111, projection=ccrs.PlateCarree())

draw_maps(get_adm_maps(level="省"), ax=ax, linewidth=0.7, color="#4d4d4d")
ax.set_extent([73, 136, 16, 54], crs=ccrs.PlateCarree())

for province_name, city_name, english_name in province_capitals:
    row = get_adm_maps(city=city_name, record="first")
    lon = row.longitude
    lat = row.latitude

    if english_name == "Beijing":
        ax.scatter(
            [lon],
            [lat],
            color="#d62828",
            s=70,
            marker="*",
            transform=ccrs.PlateCarree(),
            zorder=6,
        )
    else:
        ax.scatter(
            [lon],
            [lat],
            color="#d62828",
            s=10,
            transform=ccrs.PlateCarree(),
            zorder=5,
        )

    ax.annotate(
        english_name,
        xy=(lon, lat),
        xycoords=ccrs.PlateCarree()._as_mpl_transform(ax),
        xytext=(0, 6),
        textcoords="offset points",
        ha="center",
        va="bottom",
        fontsize=7,
        color="#111111",
        zorder=7,
    )

ax.gridlines(draw_labels=False, linewidth=0.35, color="#999999", alpha=0.35, linestyle="--")
plt.tight_layout()
plt.savefig("province-capitals-labeled.png", bbox_inches="tight")
plt.show()

合并边界
cnmaps可以很方便地对地图进行合并,例如我们可以将北京、天津、河北的边界对象直接相加获得京津冀的边界对象并绘图。
import cartopy.crs as ccrs
import matplotlib.pyplot as plt
from cnmaps import get_adm_maps, draw_map

beijing = get_adm_maps(province='北京市', only_polygon=True, record='first')
tianjin = get_adm_maps(province='天津市', only_polygon=True, record='first')
hebei = get_adm_maps(province='河北省', only_polygon=True, record='first')

jingjinji = beijing + tianjin + hebei

fig = plt.figure(figsize=(5,5))
ax = fig.add_subplot(111, projection=ccrs.PlateCarree())
draw_map(jingjinji)

plt.show()
剪切地图
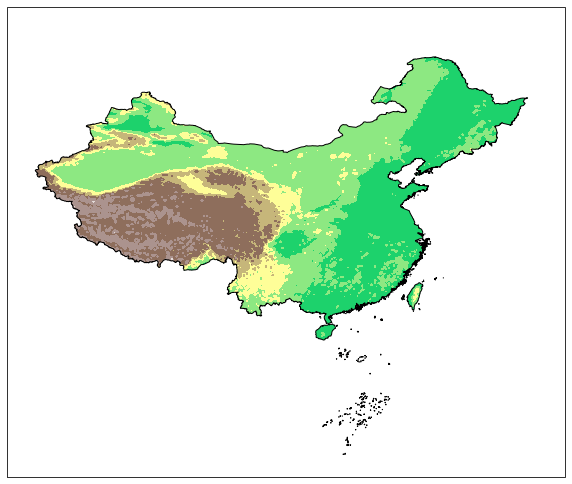
剪切填色等值线(contourf)图
import numpy as np
import matplotlib.pyplot as plt
import cartopy.crs as ccrs
from cnmaps import get_adm_maps, clip_contours_by_map, draw_map
from cnmaps.sample import load_dem

lons, lats, data = load_dem()

fig = plt.figure(figsize=(10, 10))
ax = fig.add_subplot(111, projection=ccrs.PlateCarree())
map_polygon = get_adm_maps(country='中国', record='first', only_polygon=True)

cs = ax.contourf(lons, lats, data,
                cmap=plt.cm.terrain,
                levels=np.linspace(-2800, data.max(), 10),
                transform=ccrs.PlateCarree())

clip_contours_by_map(cs, map_polygon)
draw_map(map_polygon, color='k', linewidth=1)
clip_contours_by_map、clip_pcolormesh_by_map、clip_quiver_by_map、clip_scatter_by_map 除了支持单个 MapPolygon,也支持直接传入 MapPolygon 列表或 GeoDataFrame,适合一次性裁剪多个行政区组合结果。
若你只想裁剪到某个经纬度窗口内,不必再手工构造矩形 MapPolygon 并与行政边界求交;可以直接传 extent=[left, right, lower, upper],并在需要时加上 set_extent=True 一步完成裁剪和坐标范围收紧。
plt.show()
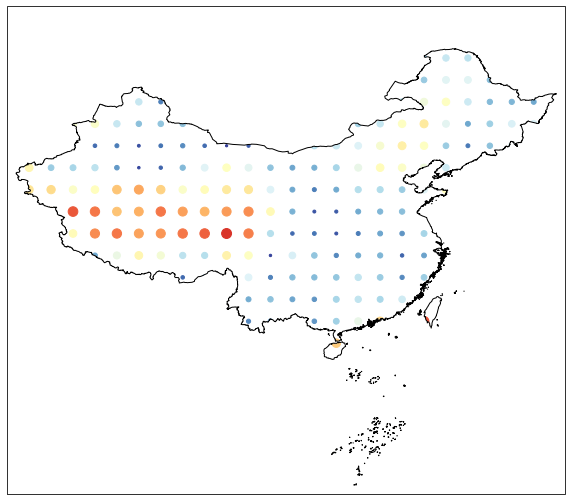
在多子图场景下,clip_contours_by_map 也会自动识别 contour / contourf 对象所属的 Axes,因此通常不必再手动传 ax=...。下面这个例子用北京市边界分别裁剪 DEM 和气温场,并排展示两种结果:
import numpy as np
import matplotlib.pyplot as plt
import cartopy.crs as ccrs
from cnmaps import get_adm_maps, clip_contours_by_map, draw_map
from cnmaps.sample import load_dem, load_temp

dem_lons, dem_lats, dem = load_dem()
temp_lons, temp_lats, temp = load_temp()
beijing = get_adm_maps(city='北京市', only_polygon=True, record='first')
extent = beijing.get_extent(buffer=0.15)

fig, axes = plt.subplots(
    1, 2, figsize=(10, 4.6), subplot_kw={'projection': ccrs.PlateCarree()}
)

panels = [
    ('Beijing DEM', dem_lons, dem_lats, dem, plt.cm.terrain, np.linspace(-200, dem.max(), 10)),
    ('Beijing Temperature', temp_lons, temp_lats, temp, plt.cm.coolwarm, np.linspace(-20, 36, 10)),
]

for ax, (title, lons, lats, data, cmap, levels) in zip(axes, panels):
    cs = ax.contourf(
        lons,
        lats,
        data,
        levels=levels,
        cmap=cmap,
        transform=ccrs.PlateCarree(),
    )
    clip_contours_by_map(cs, beijing, extent=extent, set_extent=True)
    draw_map(beijing, ax=ax, color='black', linewidth=1.0)
    ax.set_title(title)

plt.tight_layout()
plt.show()

剪切填色(pcolormesh)图
import cartopy.crs as ccrs
import matplotlib.pyplot as plt
from cnmaps import get_adm_maps, draw_map, clip_pcolormesh_by_map
from cnmaps.sample import load_dem

lons, lats, dem = load_dem()
fig = plt.figure(figsize=(10, 10))

map_polygon = get_adm_maps(country='中国', record='first', only_polygon=True)

ax = fig.add_subplot(111, projection=ccrs.PlateCarree())
mesh = ax.pcolormesh(lons, lats, dem, cmap=plt.cm.terrain, vmin=-2800, transform=ccrs.PlateCarree())
clip_pcolormesh_by_map(mesh, map_polygon)
draw_map(map_polygon, color='k')
ax.set_extent(map_polygon.get_extent())

plt.show()
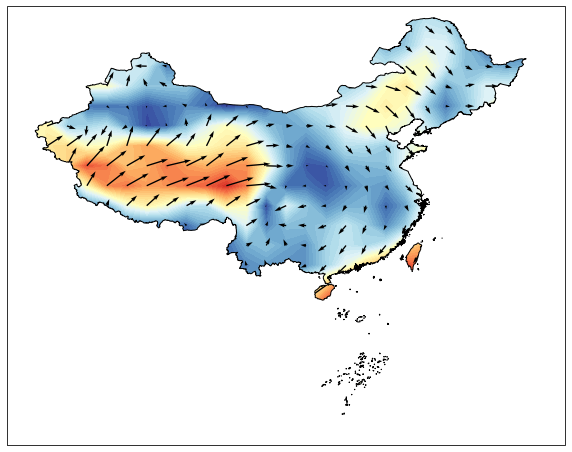
剪切箭矢簇(quiver)图
import numpy as np
import cartopy.crs as ccrs
import matplotlib.pyplot as plt
from cnmaps import get_adm_maps, clip_quiver_by_map, clip_contours_by_map, draw_map
from cnmaps.sample import load_wind

lons, lats, u, v = load_wind()

fig = plt.figure(figsize=(10, 10))
ax = fig.add_subplot(111, projection=ccrs.PlateCarree())
map_polygon = get_adm_maps(country='中国', record='first', only_polygon=True)

spd = (u ** 2 + v ** 2) ** 0.5

qv = ax.quiver(lons, lats, u, v,transform=ccrs.PlateCarree(), zorder=2)
cs = ax.contourf(lons, lats, spd, cmap=plt.cm.RdYlBu_r,
                levels=np.linspace(spd.min(), spd.max(), 50),
                transform=ccrs.PlateCarree(), zorder=1)

clip_contours_by_map(cs, map_polygon)
clip_quiver_by_map(qv, map_polygon)

draw_map(map_polygon, color='k', linewidth=1)

plt.show()
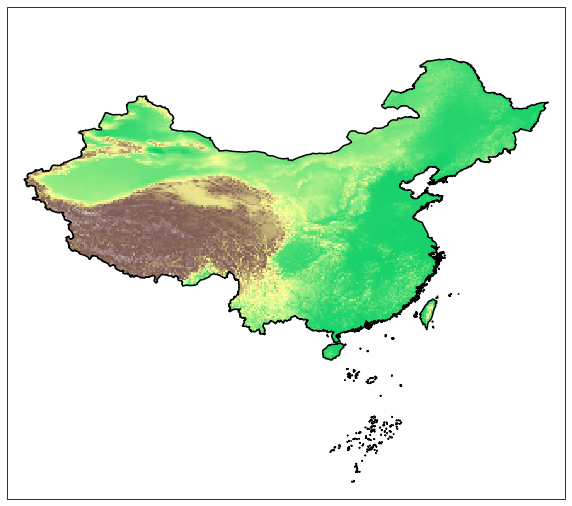
剪切山地阴影图(imshow / hillshade)
import cartopy.crs as ccrs
import matplotlib.pyplot as plt
from matplotlib.colors import LightSource
from cnmaps import get_adm_maps, clip_imshow_by_map, draw_map
from cnmaps.sample import load_dem

lons, lats, dem = load_dem()
hillshade = LightSource(azdeg=315, altdeg=45).shade(
    dem,
    cmap=plt.cm.Greys,
    vert_exag=0.8,
    blend_mode='overlay',
)

fig = plt.figure(figsize=(10, 10))
ax = fig.add_subplot(111, projection=ccrs.PlateCarree())
map_polygon = get_adm_maps(country='中国', record='first', only_polygon=True)

image = ax.imshow(
    hillshade,
    extent=[lons.min(), lons.max(), lats.min(), lats.max()],
    origin='lower',
    transform=ccrs.PlateCarree(),
)

clip_imshow_by_map(image, map_polygon)
draw_map(map_polygon, color='k', linewidth=1)
ax.set_extent(map_polygon.get_extent())

plt.show()

剪切流线图(streamplot)
import cartopy.crs as ccrs
import matplotlib.pyplot as plt
from cnmaps import get_adm_maps, clip_streamplot_by_map, draw_map
from cnmaps.sample import load_wind

lons, lats, u, v = load_wind()

fig = plt.figure(figsize=(10, 10))
ax = fig.add_subplot(111, projection=ccrs.PlateCarree())
map_polygon = get_adm_maps(country='中国', record='first', only_polygon=True)

stream = ax.streamplot(
    lons[0, :],
    lats[:, 0],
    u,
    v,
    transform=ccrs.PlateCarree(),
    density=2.0,
    color='#1f77b4',
)

clip_streamplot_by_map(stream, map_polygon)
draw_map(map_polygon, color='k', linewidth=1)

plt.show()

剪切散点(scatter)图
import numpy as np
import cartopy.crs as ccrs
import matplotlib.pyplot as plt

from cnmaps import get_adm_maps, clip_scatter_by_map, draw_map
from cnmaps.sample import load_wind

lons, lats, u, v = load_wind()
spd = (u ** 2 + v ** 2) ** 0.5

data = list(zip(lons.flatten(), lats.flatten(), spd.flatten()))

x = [s[0] for s in data]
y = [s[1] for s in data]
z = [s[2] for s in data]

map_polygon = get_adm_maps(record='first', only_polygon=True)

fig = plt.figure(figsize=(10, 10))
ax = fig.add_subplot(111, projection=ccrs.PlateCarree())
scatter = ax.scatter(x, y, s=np.array(z)*10, c=z,
                     cmap=plt.cm.RdYlBu_r, transform=ccrs.PlateCarree())
clip_scatter_by_map(scatter, map_polygon)
draw_map(map_polygon, linewidth=1)
ax.set_extent(map_polygon.get_extent(buffer=1))

plt.show()
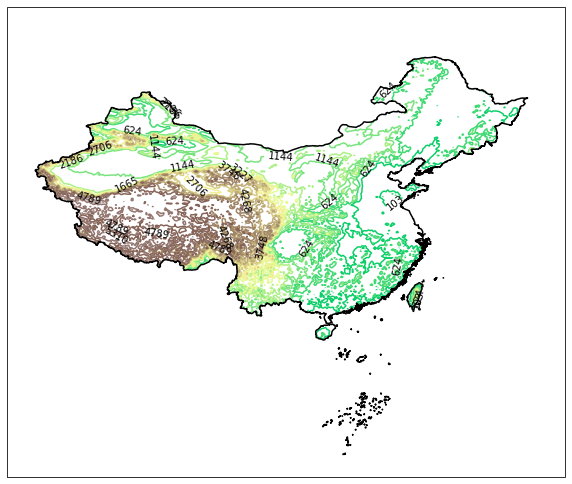
剪切等值线clabel
import numpy as np
import matplotlib.pyplot as plt
import cartopy.crs as ccrs
from cnmaps import get_adm_maps, clip_clabels_by_map, clip_contours_by_map, draw_map
from cnmaps.sample import load_dem

lons, lats, data = load_dem()

map_polygon = get_adm_maps(
    country='中国', record='first', only_polygon=True)
fig = plt.figure(figsize=(10, 10))
ax = fig.add_subplot(111, projection=ccrs.PlateCarree())
contours = ax.contour(lons,
                        lats,
                        data,
                        cmap=plt.cm.terrain,
                        levels=np.linspace(-2500, data.max(), 20),
                        transform=ccrs.PlateCarree())
clip_contours_by_map(contours, map_polygon)
clabels = ax.clabel(contours,
                        levels=contours.levels,
                        colors='k',
                        fmt='%i',
                        inline=True)
clip_clabels_by_map(clabels, map_polygon)
draw_map(map_polygon, color='k')
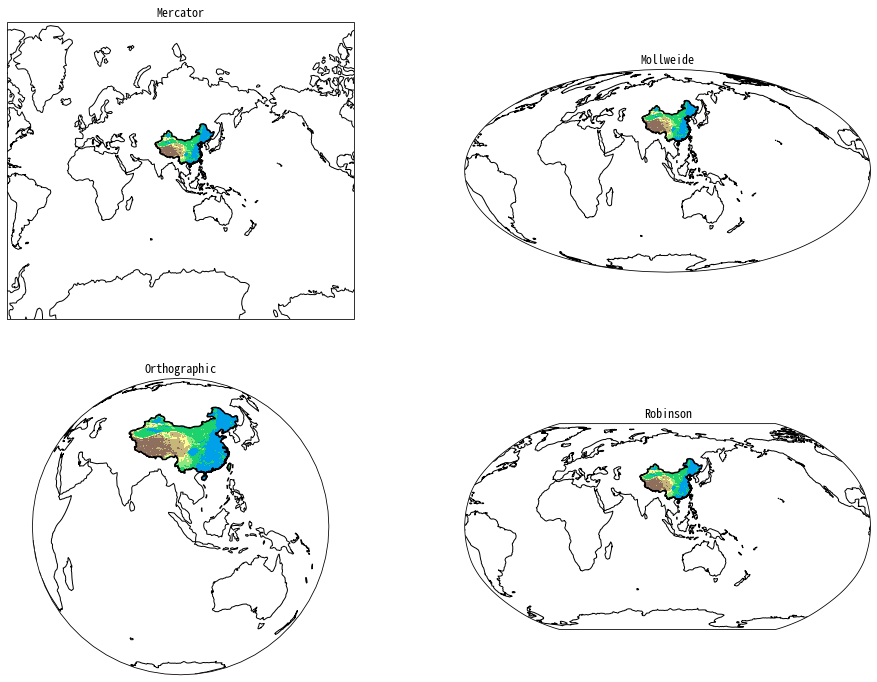
多投影支持
import cartopy.crs as ccrs
import matplotlib.pyplot as plt
from cnmaps import get_adm_maps, draw_map, clip_contours_by_map
from cnmaps.sample import load_dem

lons, lats, dem = load_dem()

PROJECTIONS = [
    ('Mercator', ccrs.Mercator(central_longitude=100)),
    ('Mollweide', ccrs.Mollweide(central_longitude=100)),
    ('Orthographic', ccrs.Orthographic(central_longitude=100)),
    ('Robinson', ccrs.Robinson(central_longitude=100))
]

fig = plt.figure(figsize=(16, 12))
fig.tight_layout()

china = get_adm_maps(country='中国', record='first', only_polygon=True)

for i, prj in enumerate(PROJECTIONS):
    ax = fig.add_subplot(2,2,i+1, projection=prj[1])
    cs = ax.contourf(lons, lats, dem, cmap=plt.cm.terrain, transform=ccrs.PlateCarree())
    clip_contours_by_map(cs, china)

    draw_map(china, color='k')
    ax.set_extent(china.get_extent(buffer=3))
    ax.set_global()
    ax.coastlines()
    plt.title(prj[0])

plt.show()
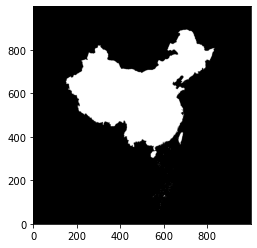
栅格遮罩
cnmaps 可以基于地图矢量数据对栅格格点数据进行遮罩(掩膜)操作,生成遮罩层对数据进行遮罩。
下面的例子可以生成中国国界的遮罩数组。
import numpy as np
from cnmaps import get_adm_maps
import matplotlib.pyplot as plt

lon = np.linspace(60, 150, 1000)
lat = np.linspace(0, 60, 1000)
lons, lats = np.meshgrid(lon, lat)

china = get_adm_maps(country="中国", level="国", record="first", only_polygon=True, wgs84=True)
china_maskout_array = china.make_mask_array(lons, lats)

plt.imshow(china_maskout_array, cmap='binary', origin='lower')
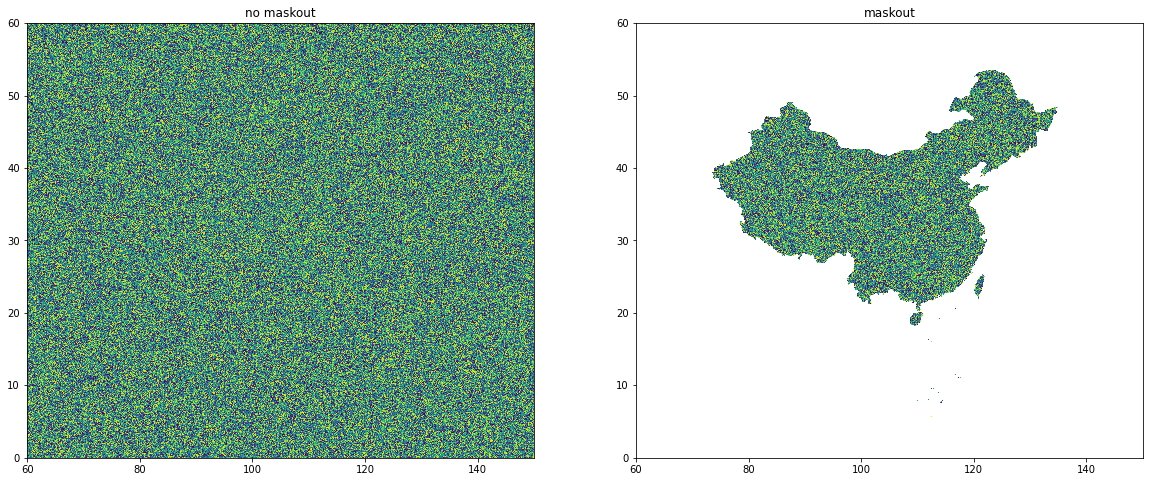
我们也可以直接对栅格数据进行遮罩。
import numpy as np
from cnmaps import get_adm_maps
import matplotlib.pyplot as plt

lon = np.linspace(60, 150, 1000)
lat = np.linspace(0, 60, 1000)

lons, lats = np.meshgrid(lon, lat)
data = np.random.random(lons.shape)

china = get_adm_maps(country="中国", level="国", record= "first", only_polygon=True, wgs84=True)

maskout_data = china.maskout(lons, lats, data)

plt.figure(figsize=(20,8))

plt.subplot(121)
plt.pcolormesh(lons, lats, data)
plt.title("no maskout")

plt.subplot(122)
plt.pcolormesh(lons, lats, maskout_data)
plt.title("maskout")
plt.show()
输出矢量文件
cnmaps 支持将查询到的矢量边界输出为 GeoJSON 或 ESRI Shapefile 文件。
如果你希望直接在命令行里完成“查询 + 导出”,可以使用 cnmaps export。它支持与 get_adm_maps 接近的筛选参数,例如 country、province、city、district、level、source、provider、record、simplify 等;当某个筛选项需要多个值时,可以在同一个参数后依次写出多个名称。
cnmaps export ./jingjin.geojson --province 北京市 天津市 --level 省
cnmaps export ./east-asia.geojson --country 中国 JPN KOR --level 国
cnmaps export ./henan.shp --province 河南省 --level 省 --record first
输出路径默认会按后缀自动推断格式:.geojson / .json 对应 GeoJSON,.shp 对应 ESRI Shapefile;如果你想显式指定,也可以追加 --engine GeoJSON 或 --engine "ESRI Shapefile"。坐标默认输出为 WGS84,如需导出 GCJ02,可追加 --gcj02。
如果你已经在 Python 代码中拿到了边界对象,也可以继续使用 MapPolygon.to_file(...):
from cnmaps import get_adm_maps

china = get_adm_maps(country="中国", level="国", record= "first", only_polygon=True, wgs84=True)

china.to_file('./china.geojson')  # 默认为 geojson 格式文件
china.to_file('./china.shp', engine='ESRI Shapefile')  # 也可以指定 shapefile 格式文件
读取自定义边界文件
除了内置行政边界以外,cnmaps 也支持读取“符合 cnmaps boundary spec 的外部 GeoJSON / Shapefile 文件”,并将其转换为 MapPolygon,继续用于 make_mask_array、maskout、clip_* 等工作流。
当前这套 boundary spec 的核心要求是:
文件格式为
.geojson/.json/.shpCRS 必须明确且等价为 WGS84(
EPSG:4326)几何必须全部为
Polygon或MultiPolygon不能包含空几何或无效几何
如果文件包含多个 feature,cnmaps 会在读取时先将它们合并为一个统一边界。
推荐先用命令行检查文件是否符合规范:
cnmaps check-boundary ./my-boundary.geojson
cnmaps check-boundary ./my-boundary.shp --json  # 将检查结果以 JSON 输出
检查通过后,就可以在 Python 代码中读取并继续做掩膜:
from cnmaps import read_boundary_file

boundary = read_boundary_file("./my-boundary.geojson")
mask = boundary.make_mask_array(lons, lats)
masked = boundary.maskout(lons, lats, data)
如果你的原始 shp / geojson 还不符合这套规范,推荐先借助 AI 或 GIS 工具把它整理为符合 cnmaps boundary spec 的结构,再交给 cnmaps 检查和读取。
如果你希望借助 AI 来完成这一步,推荐先按 安装 中的说明安装 cnmaps 自带的 AI Skill,再向 AI 发送类似下面的提示词:
帮我把 <path/filename.shp> 转为符合 cnmaps 可识别格式的 shapefile/geojson 文件,并通过 cnmaps 的 check-boundary 检查。
这样 AI 会更容易按照 cnmaps boundary spec 去整理文件结构;整理完成后,再执行 cnmaps check-boundary ... 验证是否通过即可。